clicking  the play button;
clicking on the date or dragging the pointer on the timeline.
There are in total 8 types of COVID-19 variables that can be mapped. You can visualize them through the [Cases] menu.
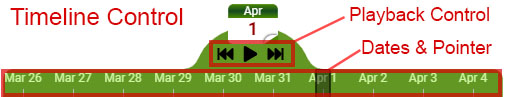
Timeline is at the bottom of the screen. It allows you to
clicking the play button;clicking on the date or dragging the pointer on the timeline.
The map and charts are linked together. Hovering on a country's bubble to reveal actual cases for the country with a tooltip. Meanwhile, the country's record will be highlighted in the data table (right panel).
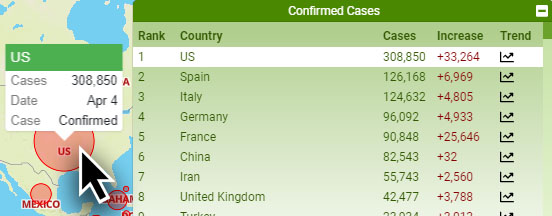
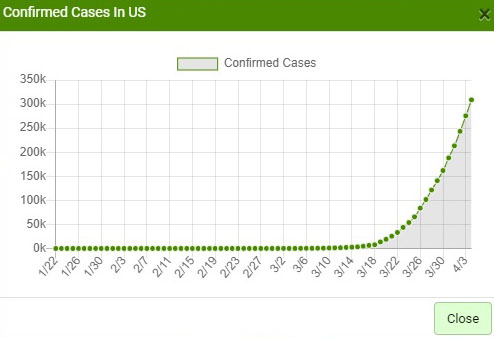
Clicking on the buble to show the time-series cases for the country.
Hovering on a country's name in the data table (right panel) will also zoom in to that country on the map.
You can zoom in to specific continents using the [Locations] menu.
Cases for Diamond Princess & MS Zaanda & Grand Princess may be mapped in Africa (latitude=0, langitude=0) due to incorrect georeference in the original data source.