GeoAI platforms for automating laborious manual observation associated with wheat production
early grain grading and crop yield estimation videos
Grain Grading
1. Current Practice
Problem Statement:“For 40 years, Western Canada’s grain industry has dreamed about the black box — an affordable machine that would take a handful of wheat and quickly and accurately spit out its end-use quality on the elevator driveway.” (Cereals News). However, the current grain grading systems rely on time-consuming paper-based visual grading systems that are released once a year based on grain samples submitted annually. Currently, grain inspectors manually identify, separate, and analyze degrading kernels to determine grain quality and grading. These manual and subjective tasks are slow, unreliable, inaccurate and lead to stress and commercial conflict between the buyer and seller. On top of all these problems, the global marketplace has been moving away from regulatory-based grading platforms to specification-based grading systems, driven primarily by the food ingredient industry, as proven by the rise of the falling number test as a specification in grading wheat. This transition is being supported by the rise in demand for plant protein fractions and the business need for more consistent and predictable processing specifications directly related to production consistency and efficiency of final food products.
Inaccuracies in grain grading and dockage determination can cost growers hundreds of millions of dollars per year. Crop News, 2019
2. Super GeoAI Grain Grading Application
Super GeoAI Grain Grading Product User Cases
With recent advances in technology, our GeoAI-driven mobile and cloud applications can be used in the following seven scenarios.
1. Public growers: thousand kernel weight (TKW) mobile application
“Thousand kernel weight (TKW) is highly useful for calculating the optimal seeding rate for a given crop type or variety, and it can also be used to calibrate a seed drill as well as estimate yields. If you don’t know your TKW, you will overplant, causing competition for nutrients and moisture. That will also increase your costs unnecessarily as the cost of seed, fuel and other farm input costs continue to increase. Planting too little seed is also a possibility. An inadequate stand in pulses means the weed population can get an easier foothold.” (Alberta Seed Growers).
Current Practice: Farmers either (1) manually count 2000-5000 seed samples; (2) perform a TKW test at a laboratory for $18-$70; (3) purchase a $750 automatic seed counter.
Our Solution: Users take a handful of wheat seeds (~ 500), place them on a standard A4 paper, and take a photo with a mobile device. Our application can count and label each seed in the photo within 1 second, with an accuracy approaching 100%. In addition, farmers can visualize the accuracy and make an adjustment if necessary. Taking a photo is much less effort than manually counting ~500 seeds. Users can take a photo of seeds 10 times and weigh all the seeds together. When the weight number is entered, our app will give users the TKW information.
2. Producers: Grain grading mobile application
Current Practice: Farmers deliver several representative samples of grain (1 000 g per sample) to grain buyers or labs.
Our Solution: Farmers take a handful of wheat seeds, place them on a table and take a photo. Our application can identify, count and label the diseased and degrading seeds (such as five primary objective (Ergot, Fusarium Damaged Kernels [FDK], Hard Vitreous Kernel [HVK], Sprout, and Sawfly) and two subjective grading factors (frost/heat stress damage [FRHTS], Green) in the photo within a few seconds. This quickly gives the farmer information about the sample that can be used in making marketing or processing decisions. Alternatively, farmers can take photos of wheat seeds and send them to grain buyers, who upload many photos to our server at once. Our application running on a graphics processing unit (GPU) can process all the photos in a few minutes.
Harvested grain quality analysis (cracked grain, dockage, unthreshed)
Current Practice: Cracked grain, dockage, and unthreshed grain affect the grain grade. Currently, farmers visually assess, manually screen, or estimate the dockage ratio in order to adjust/optimize the combine harvester settings. These manual observations suffer from inaccuracies resulting from subjective assessments.
Our Solution: Farmers take a photo of the wheat grain. From this photo our application can calculate and label the cracked, unthreshed grain (whitecaps in wheat) and calculate the dockage rate much more quickly than a manual assessment. Our solution will increase the accuracy and reduce the subjectivity in such assessments, helping to optimize combine harvester settings.
Value: Having on-farm indicative grading will allow producers to move on critical decisions such as quarantining certain loads from certain areas of a field, blending out bins to meet minimum grade varieties or segregating quality parameters into separate bins. Giving early and timely information to the producer at the time of bin loading will allow producers to manage their grain in order to preserve the highest economic value and isolate any potential negative outcomes that could either reject a bin or result in significant loss of grain material due to a toxin or unwanted material. Our technology can reduce the use of higher-GHG emitting grain cleaning and grading machines.
3. Industry Group – Legal-for-Trade Uptake Strategy (Grain elevators)
Current Practice: “Grain inspectors take a representative sample of grain (1 000g) and divide it into sub-samples of 50 g to 100 g. Each sample is analyzed, and suspect kernels are identified. Once the percentage of kernels affected by Fusarium or ergot is determined, a grading table is used to determine grade for the entire delivery.” (Farmforum and Canadian Grain Commission).
Our Solution: With our cloud platform, a document camera or projector linked to the application on a computer or smartphone is all that is required. After placing seeds on the stand, the degrading kernel factors are labeled, assessed, and can be presented on a large display, facilitating rapid identification and separation of degrading seeds by users. The output goal is for users to receive a rapid review of a grain sample that lists the number and percentage of degrading seeds. These results can be immediately documented and instantaneously shared with the grain seller and/or the delivery receiver at time of delivery. Our technology can save time and increase assessment accuracy, but at this stage it will not replace the grain inspector position and current practices. Grain Inspectors may still manually identify, separate, weigh, analyze degrading kernels.
4. Third-party grain grading Labs such as SGS Canada, Cotecna, Intertec Canada
Our Solution: Our software application can automate and digitize some gran grading factors.
5. OEM machinery, Harvest combines and seeding machines
Our GeoAI technology can be used for Harvest combines and seeding machines. Ground Truth Agriculture has recently raised a $4 million CAD ‘seed round’ to develop technology that will provide farmers with lab-quality grain analysis from their combines in real-time and with location precision, using near-infrared spectrometer cameras. Bushel Plus are developing cameras to assess the harvest loss in the combines. We will partner with them and license our technology and data for their products.
6. Online Grain Marketing
Grain markets (e.g., cxn360, FarmLink GrainFox, CGF Brokerage and Consulting) need to process fast efficient trading. Currently they need to send the sample to an independent third-party grain inspector and wait for the results to process the transaction. Our technology can speed up the trade and bring market opportunity for sellers and buyers.
Grain Grading Mobile App Demo (Draft)
Users take a handful of wheat seeds , place them on a standard A4 paper, and take a photo with a mobile device. Our application can count and label each seed and degrading seed in the photo within one second.
SGA GeoAI-Driven Cloud Platforms for wheat kernel Counting and Grading (Draft Demo)
After users upload a wheat kernel image, the platform will automatically count and label each seed in the photo within one second. It can also identify and label Fusarium damaged kernels [FDK]. In addition, users can visualize results and verify accuracy, manually fixing any errors and achieving better accuracy if necessary. This is an early demo. We are working on a new version of the cloud platform. It will be released soon.
Crop yield project
1. Super GeoAI Product User Cases
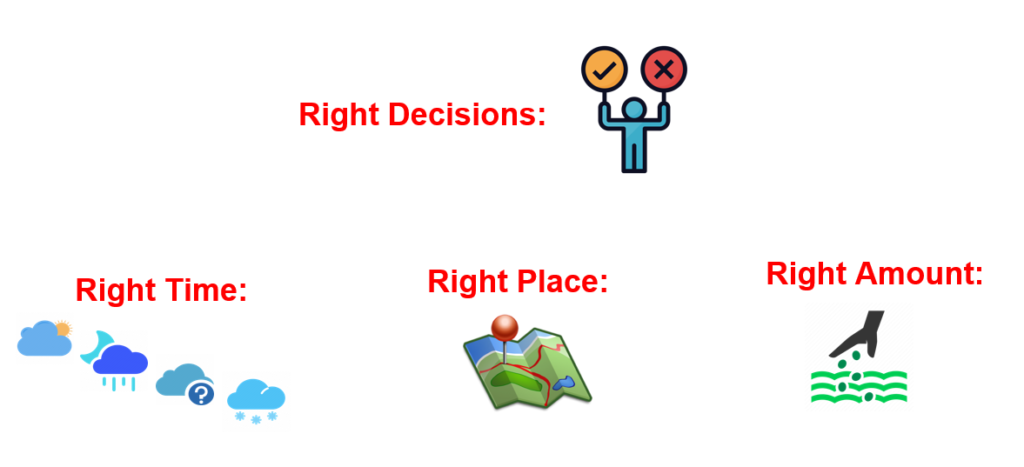
A new report commissioned by Fertilizer Canada and the Canola Council of Canada shows increased adoption of 4R (right source, right rate, right time, right place) stewardship practices could result in a 14 per cent reduction in greenhouse gas emissions from nitrogen fertilizer — approximately halfway to the Canadian government’s 30 per cent reduction target for 2030. September 8, 2022 by RealAgriculture News Team.
Farmers frequently need to make challenging decisions (right decisions, right time, right place, , and right amount) that impact crop productivity, profitability, and sustainability. Making the right decision is often the difference between profit and loss. Farmers require hard numbers to allow them to rapidly make informed decisions. However, much of this information is collected through laborious manual observation, guesswork, or subjective data collection. For example, crop yield estimation can help producers, agronomists, breeders, researchers, insurance companies, policy makers, and governments to rapidly make informed management and financial decisions. Monitoring and estimating in-field crop yield in real-time is now required more frequently due to climate change. However, obtaining accurate yield estimates at the individual farm field level still rely on inaccurate, unpleasant, and time-consuming manual observation.
Timely and accurate crop yield estimation can increase a farmer’s gross revenue by 10-30%. Below are seven business scenarios.
1. Pre-sell: When planning a sale, grain companies contact railways as far ahead as three months to confirm that they will have the capacity to move the grain. It is not uncommon for wheat prices to be 10% higher (or more) outside the harvest window. Therefore, producers usually pre-sell a portion of the wheat crop prior (possibly in July) to the harvest to obtain a favorable price. Producers need to estimate the approximate crop yield in a wheat field before they can make an informed decision on how much to charge a prospective buyer. As the market price can drop any time, producers need to know the crop yield in their field within one day. However, rapidly estimating a crop yield is a challenge.
2. Harvesting Preparation: Several weeks before harvesting, a wheat grower needs to know the crop yield in a field so that he or she can plan harvest and storage requirements, delivery estimates, and capital management.
3. Fungicide application is costly, but under the right conditions, with the right timing, it can increase a crop yield by more than 30%. With SGA technology, a high-resolution growth stage map can be created for a wheat field and combined with a high-resolution estimated wheat yield map. This information tells producers where and when to apply fungicide, and to apply fungicide only to certain areas of a field, or to time application differently in separate areas of a field to increase chemical efficacy or decrease chemical use. Our technology could result in a 10% reduction in fungicide applied to Saskatchewan fields.
Producers use the following math to decide whether they should apply fungicide.
Estimated Yield (unit/acre) x Estimated Yield Savings (%) x Selling price ($/unit) minus the fungicide application cost (%/acre) = Expected Net Return ($/acre)
If the gross revenue per acre is estimated at $480 ($8/bu @ 60 bu/ac), and a fungicide application costing $28/ac is estimated to protect 10% of the gross revenue (combination of yield and quality) 8 out of 10 years, the value for the fungicide application would be $480*10%-$28 = $20/ac. However, if the yield was estimated to be 35 bu/ac instead of 60 bu/ac, the same analysis yields a value of 0. From the knowledge, if the yield throughout the field is variable, the high value areas could be protected with a fungicide application and the low value areas would be skipped. Current analysis by producers and agrologists show that up to 10% of wheat fields do not need fungicide because they are poor performing areas that don’t justify additional inputs.
4. Fertilizer application: The Canadian government plans to reduce nitrous oxide (N2O) emissions from synthetic fertilizer by 30 per cent in 2030 relative to a 2020 baseline. The amount of nutrients used by a crop vary with the yield. A big crop requires more nutrients than a small crop. The current crop fertilization recommendation of 2.5 to 3 pounds of total N (soil reserves plus fertilizer) per bushel of hard red spring wheat means it would need a total of 250 to 300 pounds of N for 100 bushels of spring wheat. That means a very large financial, agronomic, and environmental risk. A 2022 report commissioned by Fertilizer Canada and the Canola Council of Canada shows increased adoption of 4R (right source, right rate, right time, right place) stewardship practices could result in a 14 per cent reduction in greenhouse gas emissions from nitrogen fertilizer — approximately halfway to the Canadian government’s 30 per cent reduction target for 2030. SGA technology can create high-resolution in-field crop yield maps and growth stage maps in real-time to support the 4R practices. It can decrease fertilizer use, increase fertilizer efficacy, and improve crop yield potential.
5. Crop insurance assessments: Crop insurance claims depend on damage estimation and final yield estimates. Current practices rely on costly human site visits and field data collection, or on an index (e.g. rainfall) that may not accurately reflect true damage on an individual farm (i.e. basis risk). In our solution, using farmers’ smartphone photos and drone images, the damage and yield can be accurately estimated, making insurance claims less expensive. Documentation with supporting images can also be produced for historical reference.
6. Yield estimation in large areas: Yield estimation in large areas, such as the prairie provinces depend partly on the manual collection of ground-truth data (data directly observed) regarding crop production. The current practice uses a sampling and survey method that is very expensive and time-consuming. Such surveys are usually late and contain human errors. Farmers use smartphones, cameras, or drones to take photos of wheat heads instead of manually counting the wheat head number to collect ground-truth data. Data from users in a broad region can be anonymized and aggregated to form accurate yield predictions for large areas. For example, our solution can incorporate various data sources to create high-resolution images of wheat conditions in large areas such as the province of Saskatchewan, with weekly updates until harvest. The current prairie provinces do not have such wheat maps.
7. Breeding: Traditional breeding still relies to a large degree on manual observation such as manually estimating and assessing wheat head population density on many thousands of cultivars. This time-consuming manual task is essential to select important wheat traits linked to yield potential, disease resistance or adaptation to abiotic stress. Our technology would allow breeders and researchers to take photos of wheat heads in the field and upload the photos to our application, where wheat head and health can be identified and quantified automatically. Our solution increases assessment accuracy and dramatically reduces the time and costs associated with manual crop assessment. Our solutions can help breeders and researchers to drastically reduce manual tasks so that they have more resources to select for important wheat traits.
2. The current ‘quick and easy’ practice of crop yield estimation
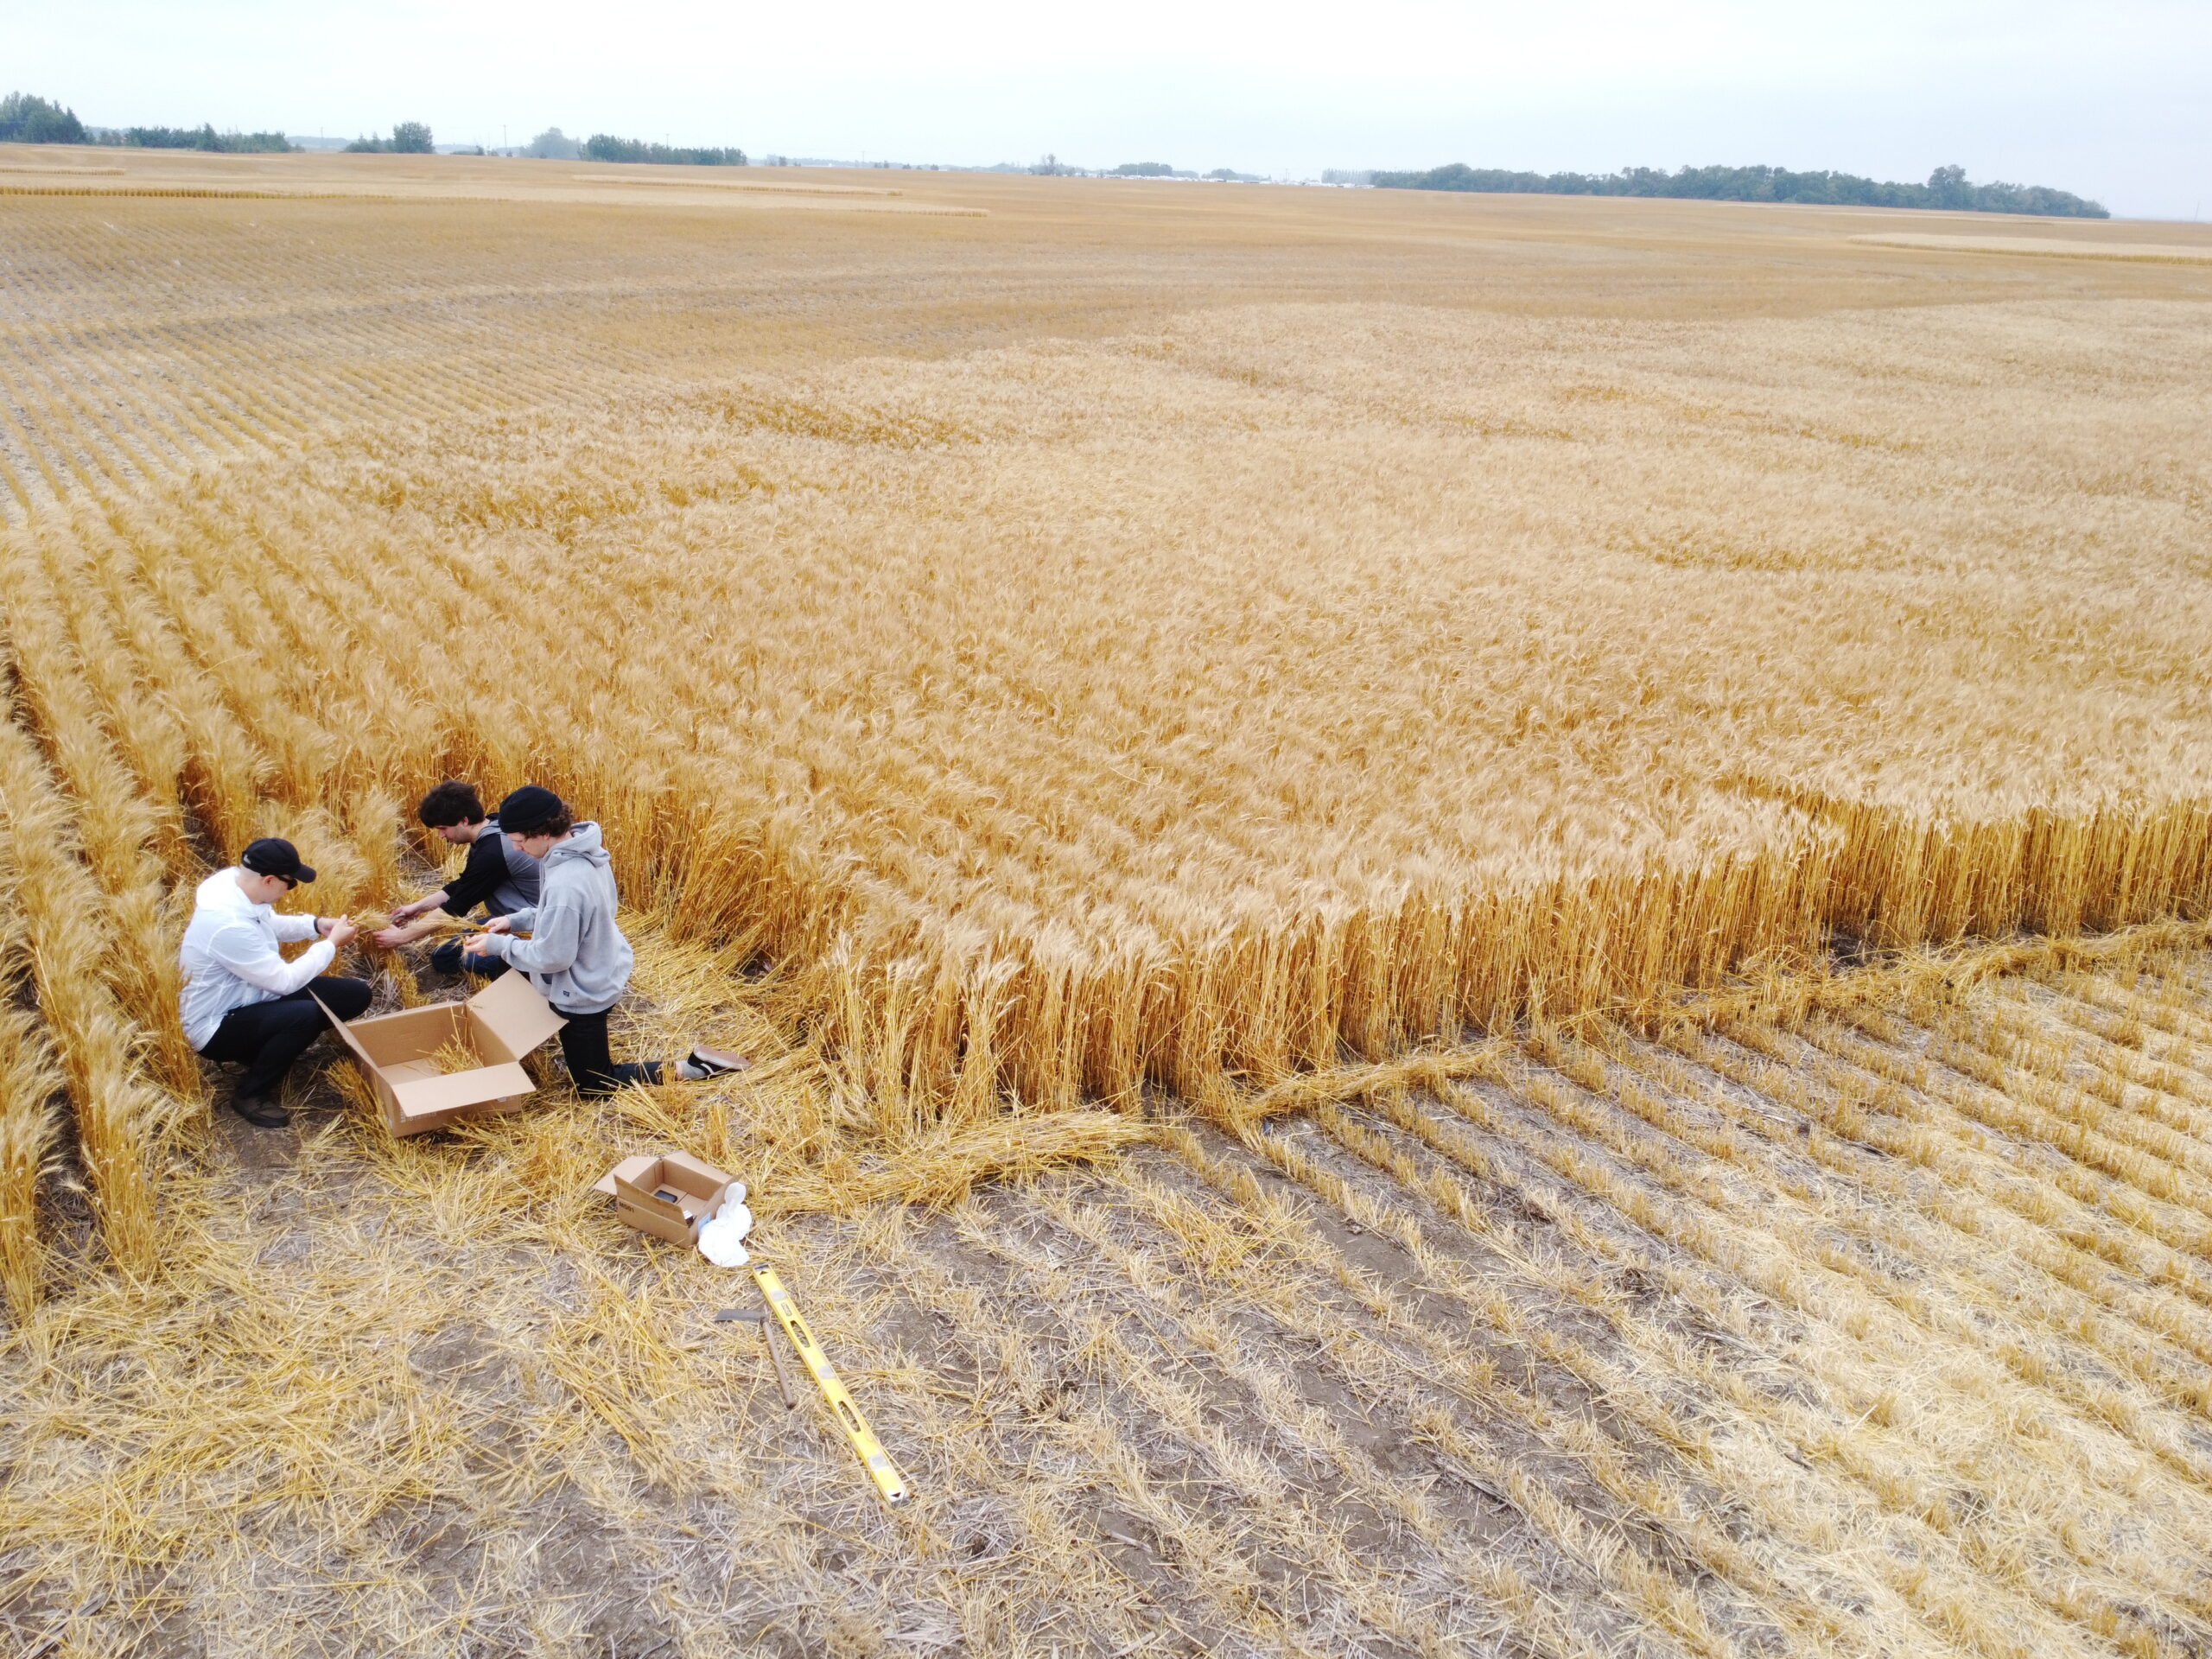
Methods: To estimate crop yield in a field, producers and agronomists randomly select and manually count the number of wheat heads from a specific length (e.g., 3 ft) of plant row in various spots around a field. By counting kernels on heads, determining the distance between rows, and applying each measure to a formula, yield can be approximated.
Problems: (1). Crop yield estimation relies on unpleasant and time-consuming manual observation. (2). Rapidly estimating crop yield is challenged due to the time it takes and the difficulty in selecting sufficient representative samples. The sustained manual work causes miscounts, and fields are seldom uniform; drought usually accentuates field yield variability.
3. Super GeoAI Smartphone Solution
Solution: Users walk with a smartphone to take several photos per representative location around a field. Our mobile application can count and label wheat heads, and calculate crop yield in the photo within three seconds, with an accuracy approaching 100%. Once users take a certain number of photos, our app can give users approximately accurate crop yield estimation (such as bushels per acre) in a field.
The smartphone photos will be first processed to calculate crop yield by our fast GeoAI algorithms in the smartphone. The photos will be automatically uploaded and processed by our advanced GeoAI algorithms in our cloud platform, provided that the internet is available. If the advanced algorithms have better results, it will update the local result. In addition, users can login to the cloud platform to visualize the accuracy and easily fix any AI mistakes to achieve 100% accuracy, if necessary.
(1). The following demo uses our mobile app prototype to take photos of wheat heads (about two rows and 3 feet length per photo). The app immediately calculates the crop yield in each photo and the average crop yield in the whole field. Click Here to download the original high-resolution video. You can select the Settings Gear Icon on the lower right-hand side of the player and Select the Quality drop down box that pops up to change YouTube Video Quality Setting.
(2). The following demo uses the smartphone camera to take several photos per representative location around a field and uses our mobile app prototype to calculate crop yield in these photos at one time. Click Here to download the original high-resolution video. You can select the Settings Gear Icon on the lower right-hand side of the player and Select the Quality drop down box that pops up to change YouTube Video Quality Setting.
4. Super GeoAI Drone Solution
Solution 1: While our mobile application can achieve approaching 100% accuracy for each photo, producers may be unable to randomly adequate representative samples throughout an non-uniform crop field. Our GeoAI-driven drones have the ability to rapidly and randomly sample throughout a field, providing a higher level of assessment accuracy over walking and selecting spots manually in the field. Our GeoAI-driven drone can automatically take off from farmers’ backyard, fly to the crop fields and take photos. Upon task completion, the drone will automatically return to the starting location. The drone image (e.g., The file size of a DJI mini 2 drone image that covers 30sq ft is about 5 MB.) will be automatically uploaded and processed to calculate crop yield by our GeoAI algorithms in our cloud platform, given that the internet and Wi-Fi is available. Users can also manually upload drone images into our cloud platform.
Users can upload drone images in our cloud platform to calculate the wheat crop yield in the images. Below is a demo video. Click on the three-dot icon at the lower right-hand side of the player to download the original high-resolution video. You can also play the reduced resolution video faster Here at YouTube.
Solution 2: Random sampling throughout a field provides higher assessment accuracy than walking and selecting spots in the field manually. However, fields are seldom uniform and drought usually accentuates field yield variability. Integrating the traditional vegetation indices and traditional crop yield prediction model into our GeoAI-driven models can create high-resolution estimated yield maps and growth stage maps of a field. We are developing our advanced GeoAI models for this solution.
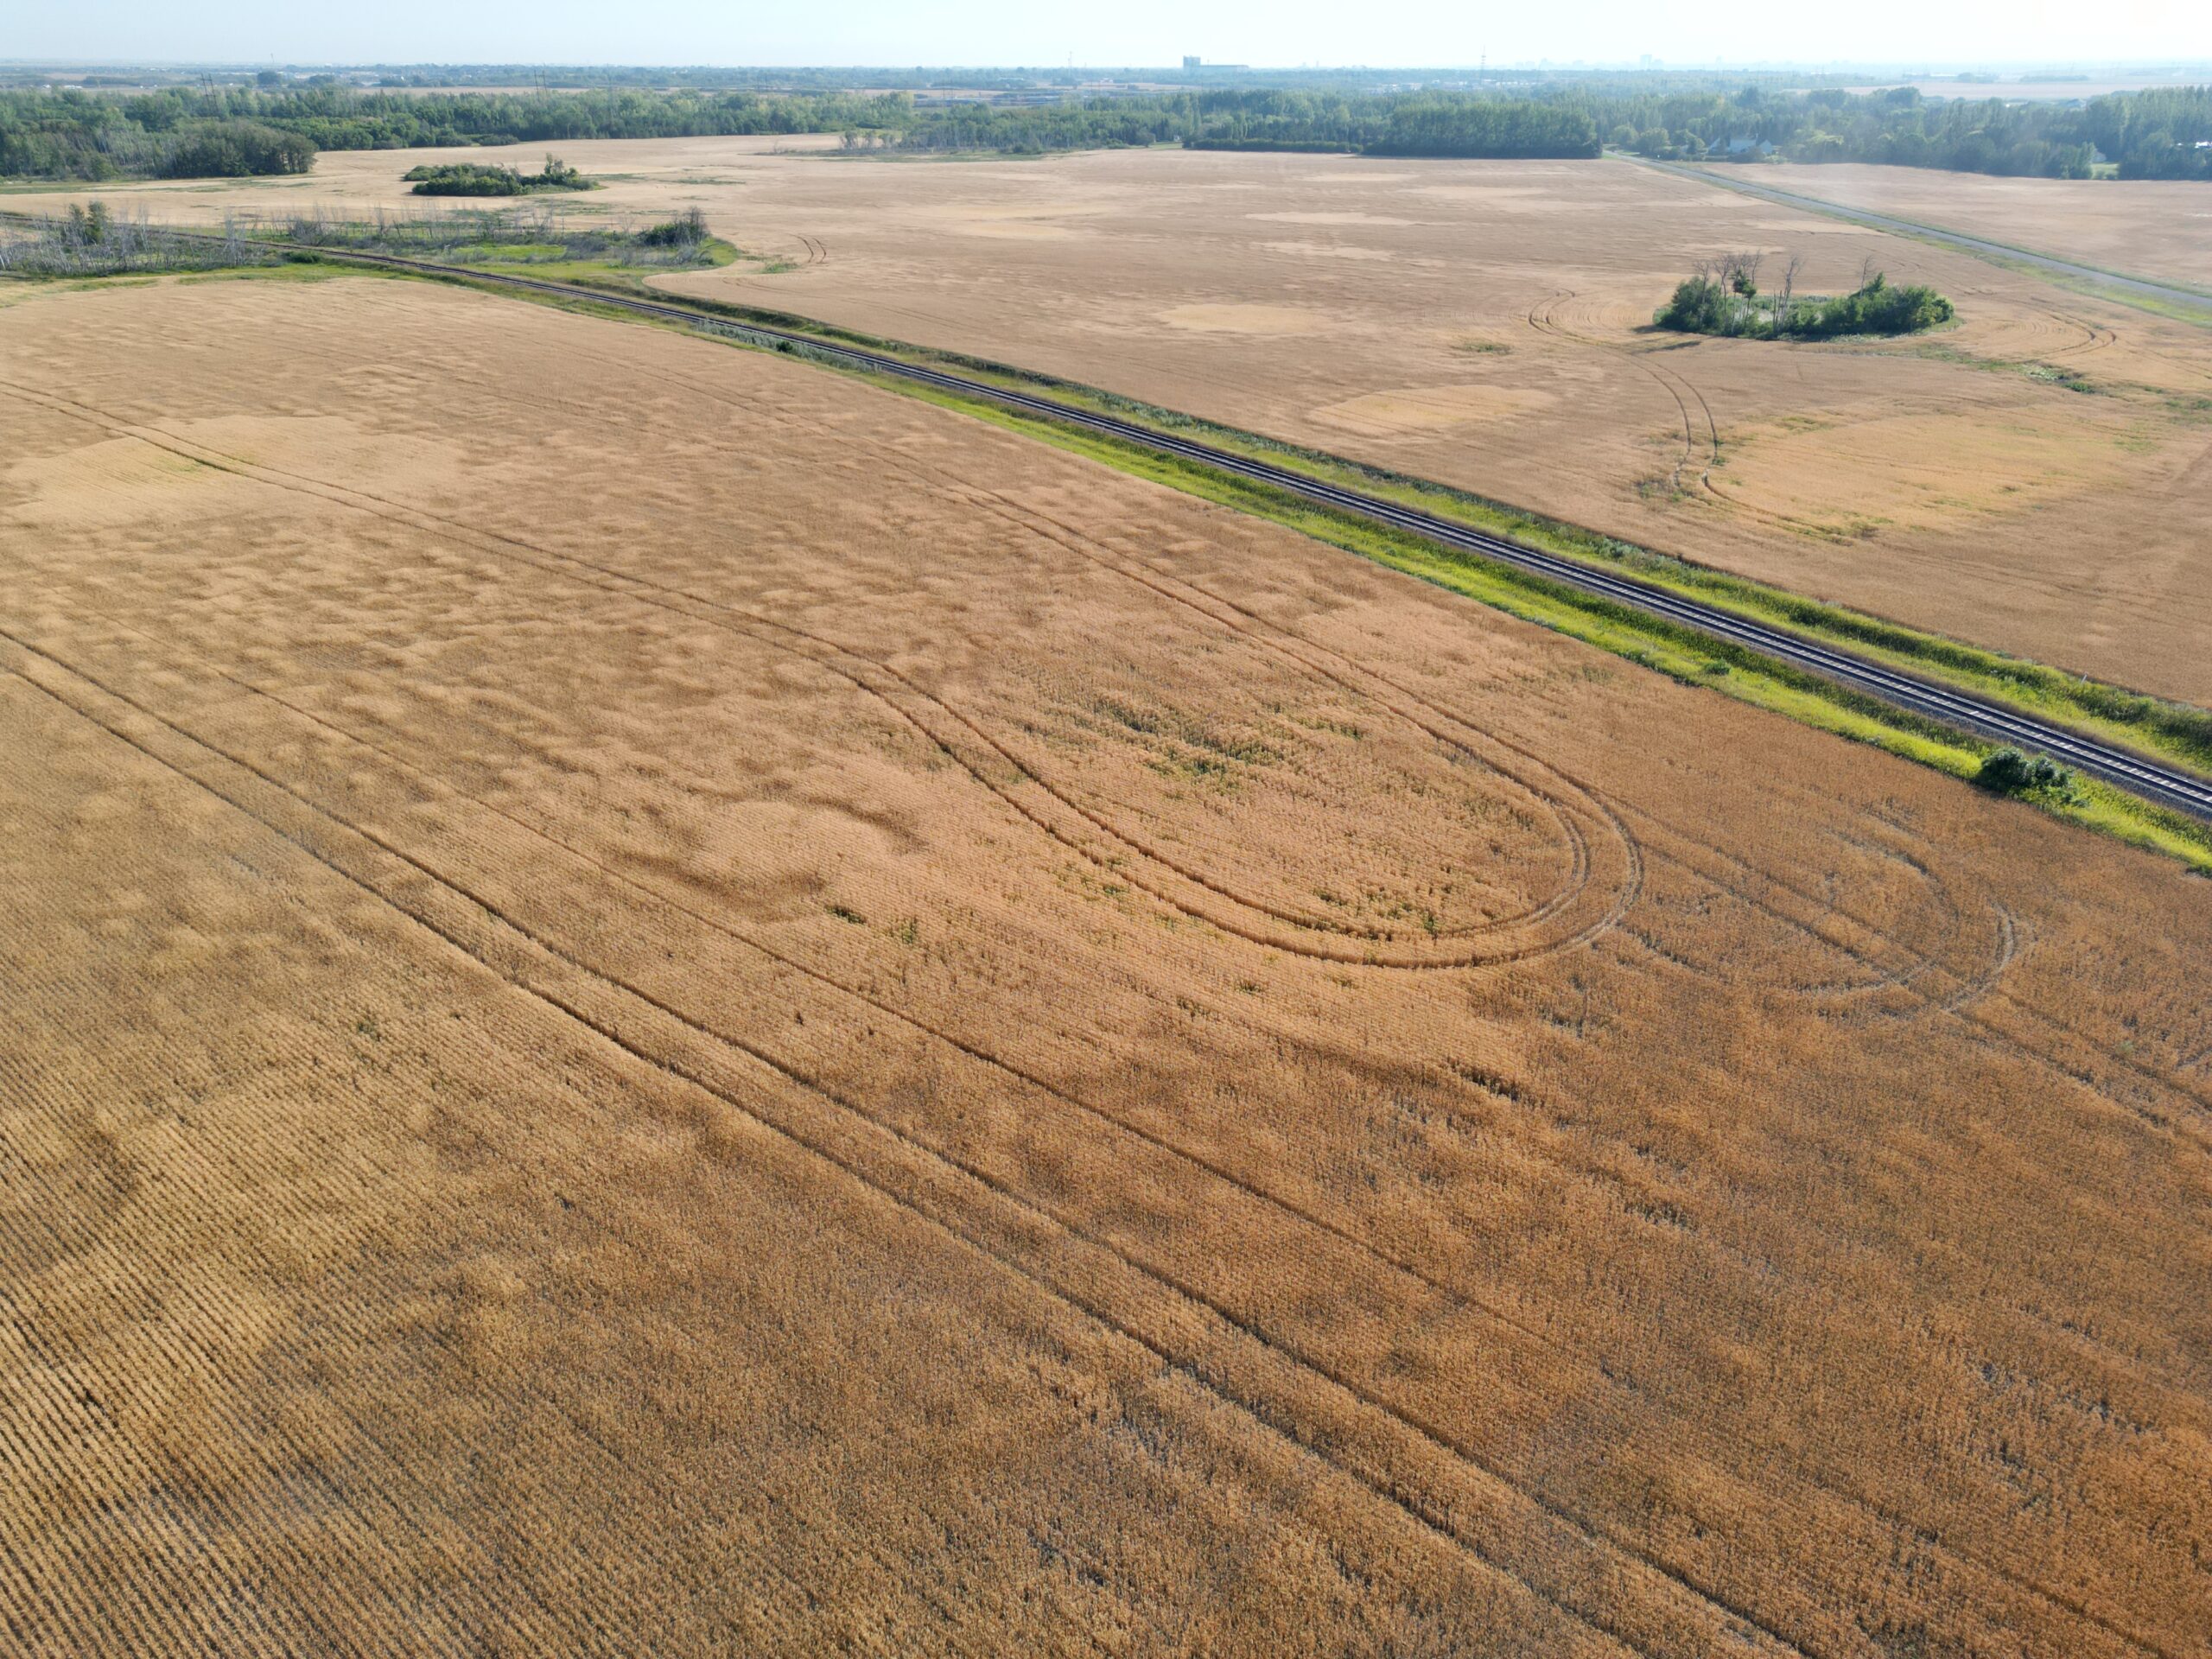
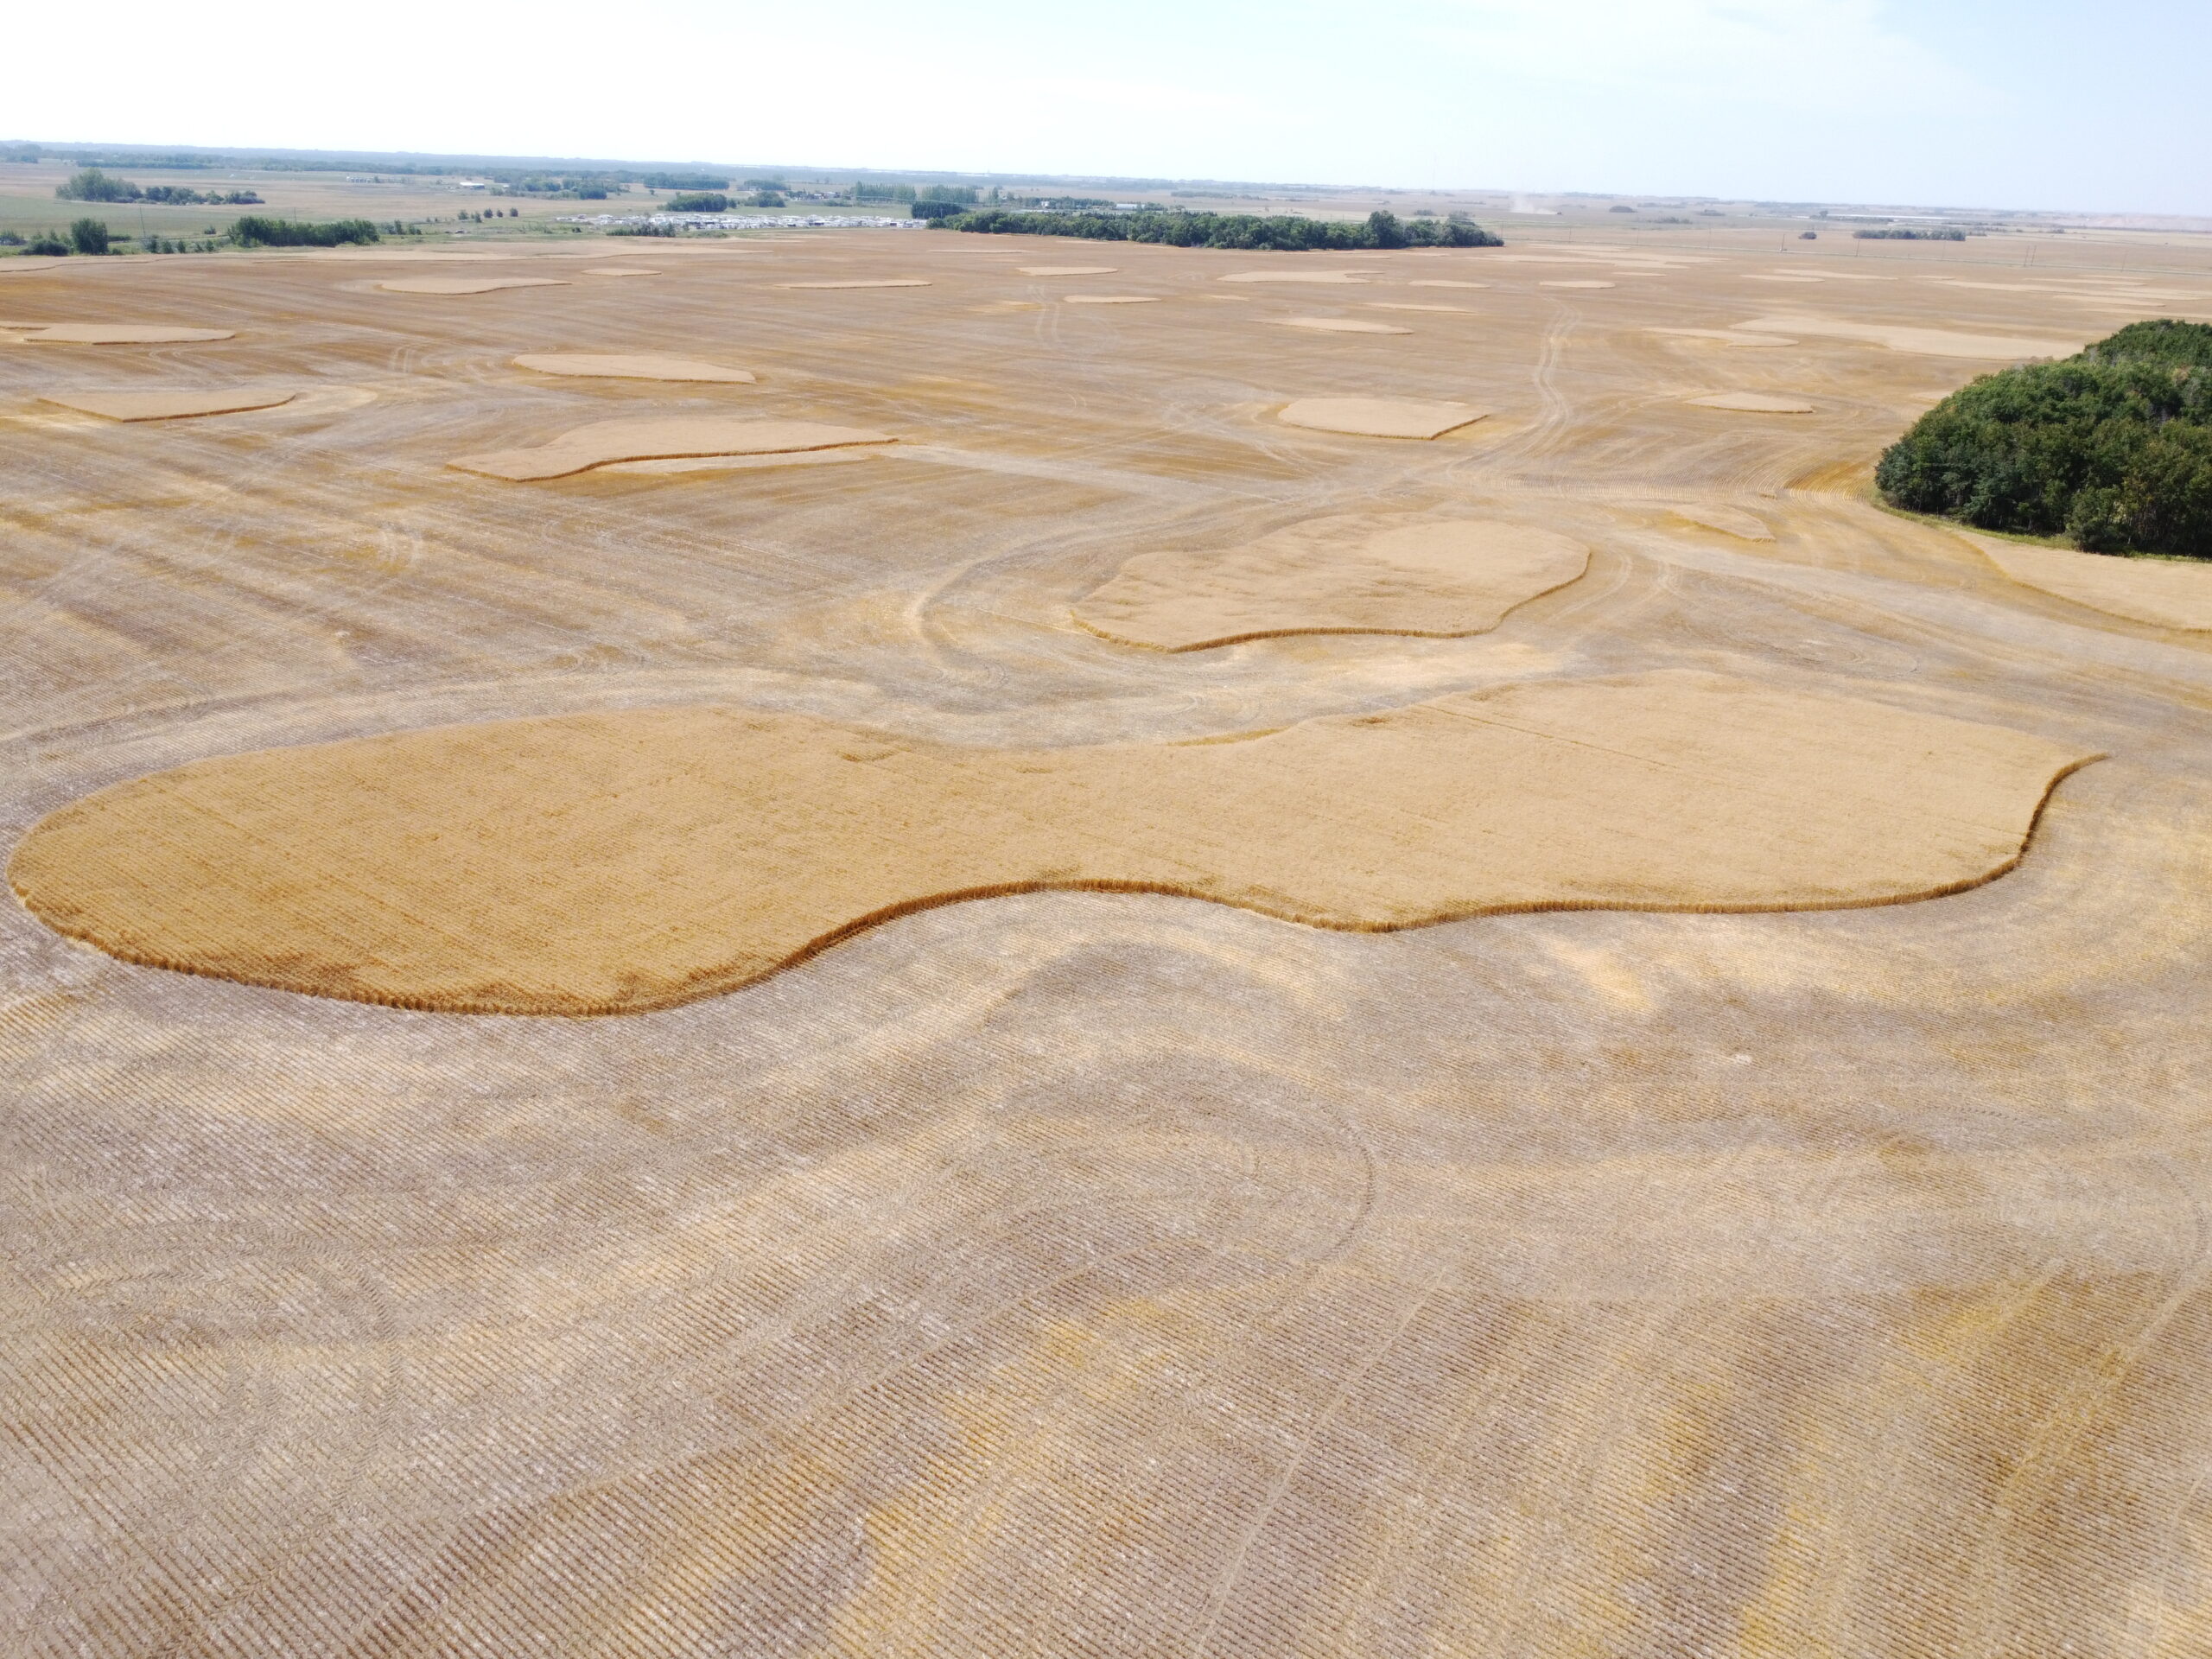
The following drone image shows the variability of crop throughout a field, where some areas have a much higher wheat yield than others.
The following drone image shows the SGA’s own non-uniform wheat field in 2022. The areas with higher yield and later maturity have not yet been harvested. A drone can take photos of the areas about 30-100 meters above ground and our GeoAI algorithms can accurately calculate these polygon areas.
The following video shows that the Dji Mini 2 drone is collecting wheat head data about 2-3 meters above ground. Click on the three-dot icon on the lower right-hand side of the player to download the original high-resolution video and play. You can also play the reduced resolution video faster Here at YouTube.
The following video (472 mb) shows the Dji Mini 2 collecting wheat data from 50 meters to 3 meters above the ground. Click Here to download the original high-resolution video. You can select the Settings Gear Icon on the lower right-hand side of the player and Select the Quality drop down box that pops up to change YouTube Video Quality Setting.
We were harvesting wheat at Super GeoAI R&D Farm Field on August 18, 2022. The brighter areas with higher yield and later maturity were harvested later.
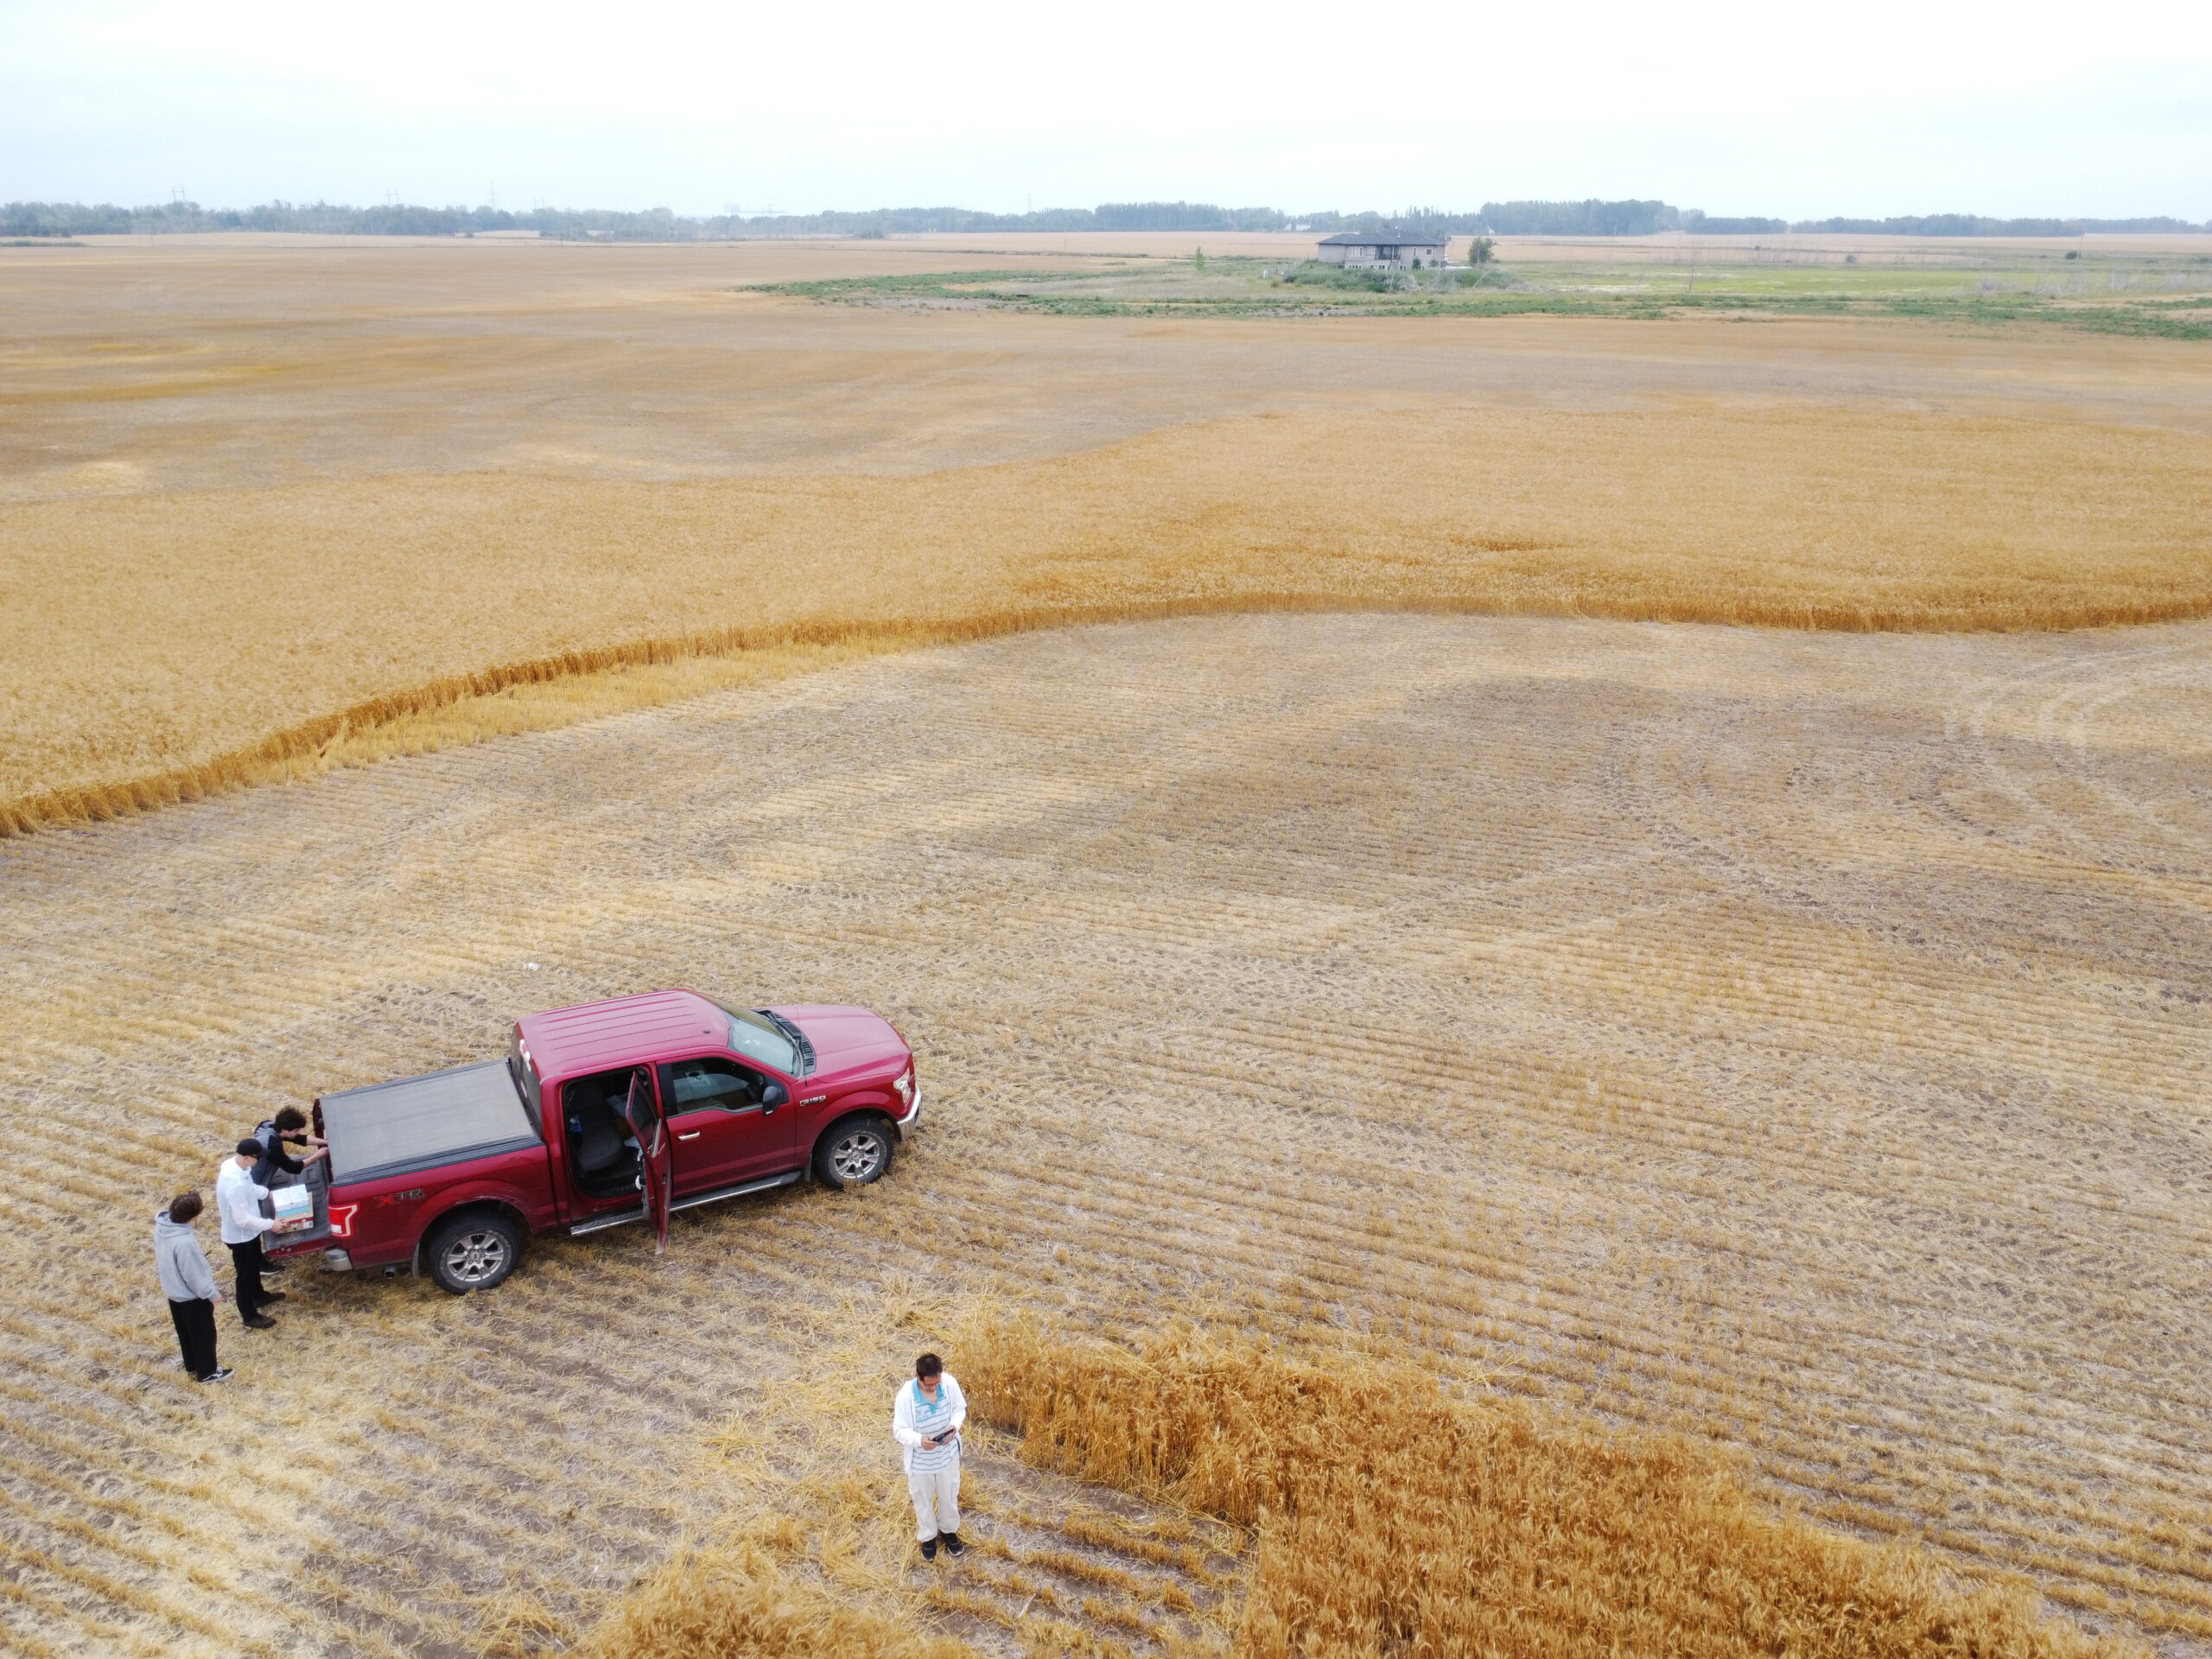
5. Super GeoAI Crop Yield Prototype Testing and Validation
Our preliminary study in SGA’s wheat field has achieved 95%-100% accuracy. In the following drone video and drone photos shows that SGA development team is testing and validating SGA’s crop yield prototypes in SGA’s wheat field in August 2022.